This document describes the proposal of the first method to obtain the level of a user’s experience in SQL using their eye tracking data, which was motivated by the importance of creating a balance between the difficulty of a task and the user’s ability, since the level of knowledge in a particular subject influences the experience, performance and acquisition of knowledge of a person when they perform these types of activities. Given the existing evidence in cognitive science that the model of a diversity of users is significantly correlated with eye tracking data, this study was directed to propose a mechanism to establish user models by discovering patterns of gaze behavior of users, through eye tracking technologies. Similarly, the results of the literature analysis are presented following the steps proposed by Kai Petersen and other authors. In this way, the identified phases for user modeling were synthesized: data collection, data processing and feature extraction, and classification. Subsequently, the way in which the participants will be labeled was defined, describing the concept of Experience, as well as the description of the stimulus with which the user will interact, the explanation of the process of the mechanism, and the specification of the participants and materials to be used. Finally, through this study it was proven that the proposed model is capable of effectively detecting the level of experience in SQL from ocular data in natural environments.
https://cdigital.uv.mx/handle/1944/52894
Data Collection:
In the next step, we proceed to collect user data, for which the non-commercial eye tracker GazeRecorder was used, capable of detecting gaze data with traditional webcams. The process of extracting ocular data consists of 3 steps:
- Add stimulus: This could be an image, video, activity, document or any other multimedia element that can elicit some reaction in the user.
- Camera setup and calibration: This step is crucial to ensure the percentage of accuracy that the mechanism has to obtain the participant’s gaze data. Calibrating the eye tracker is a task that takes less than 2 minutes. In essence, calibration is done by following a set of points on the screen with your gaze. The calibration procedure measures the position of the eye and assigns eye movements to targets (the points) with a known position.
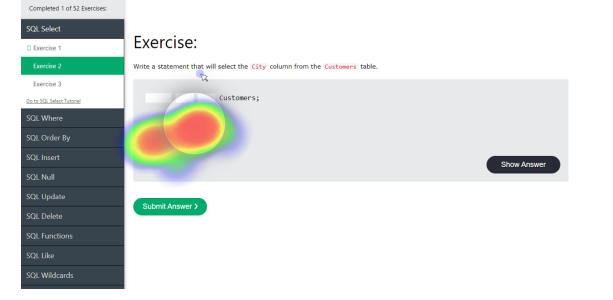
- Obtaining ocular data: This happens while the user is interacting with the stimulus, the mechanism captures the data and saves it for processing to generate the model capable of obtaining people’s traits. Given the intention of this study to use software capable of detecting gaze data with traditional webcams, it was decided to use the GazeRecorder platform, which is a free access software for non-commercial use that allows detecting and mapping the gaze of the screen using the webcam as an eye-tracker. Similarly, this tool has an online platform, which allows conducting experiments on a web page, image or video. To achieve the above, it is necessary to create an account on the GazeRecorder website. Subsequently, a new study is created indicating the stimulus with which the user will interact and the duration. As a result, a link is generated that can be sent to the participants to access the experiment. Once the participants complete the experiment, a video of the interaction with a dynamic heat map is obtained, which can be accessed online through the account that was created at the beginning (3.2). Similarly, it is possible to download a CSV document with the ocular data of all the participants. GazeRecorder was chosen for its degree of precision, and likewise, for the fact of being able to carry out these tests remotely in a simple and effective way. In this way, the objective of carrying out the experiments in an uncontrolled environment is met.
Procedure The procedure is divided into four phases:
- Preparation: This phase begins before starting the call through the Microsoft Teams platform. Basically, the eye tracker is prepared, logging into the GazeRecorder platform and obtaining a link for the test. Similarly, the form must be added within the link and the language set to Spanish.
- Introduction: The participant is welcomed and given a general description of the experiment. Similarly, it is necessary to obtain informed consent and clarify any possible doubts that may arise. Finally, the eye tracker is calibrated, for this, it is necessary to ask the participant to place themselves at a distance of 40 to 95 cm. Subsequently, they will perform a brief exercise to calibrate the eye tracker, which lasts less than 2 minutes. The calibration procedure measures the position of the eye and assigns eye movements to targets with a known position. Calibration is done by following a point on the screen.
- Execution: A series of stimuli will be presented with which the user will interact, that is, the SQL exercises. In this sense, the participants’ ocular responses will be obtained through GazeRecorder while the student completes the queries, and at the end, their demographic and academic responses will be recorded in a Google Forms form. Both platforms provide a CSV file (comma separated values) indicating the timestamp at which the response was recorded. Particularly in the ocular data, the users are listed and the stimulus is separated by window (from the website), and in this way, the x-y coordinates that the users had during the interaction are thrown. CSV files facilitate the manipulation of the data for the subsequent phase.
- Analysis: Delve into the nature of the resulting data from the interaction. Transform the coordinates into fixations and from those fixations obtain statistics that help to feed the classification algorithm: quantity, average duration, attention area, sum, standard deviation, maximum and minimum. Similarly, the way in which ocular data should be collected was proposed, this through the GazeRecorder tool thanks to its properties to carry out the tests remotely, as well as its precision, ease of use and possibility of repeating the complete interaction of the user through a video. In the next chapter, the results and discussion will be presented, for this, the way in which the nature of the data was analyzed and how the classification models are trained is shown. Derived from the above, it will be possible to visualize the interpretation of the results obtained from the study.