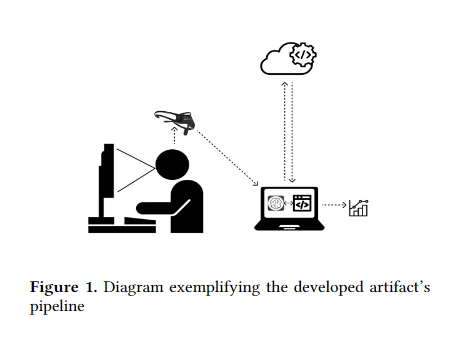
This paper describes a data visualization artifact, designedto capture, analyze and generate an imprint of the user’sbrainwaves from electroencephalographic readings in real-time during the consumption of media content. Such waves,naturally emitted by the human brain, will be mapped, cat-egorized, stored and graphically printed within the scopeof the Design Science Research methodology. The gener-ated Brain Computer Interface can be used as an input invarious systems, such as neuromarketing and media recom-mendation. Given that experience and perception of mediaconsumption is variable and, therefore, subjective amongindividuals, this research aims to obtain relevant data in thecontext of studying multimedia interaction and development.
Eye gaze mapping was chosen as the missing link betweenthe consumed content and the data gathered via EEG read-ings. In order to track the users’ ocular movements towardsthe shown content, the free webcam-based platform “GazeRecorder” was used. After each experiment, the accessoryapplication generated a heat map. It shows approximatelywhere on the screen the user was looking at during the cho-sen period of time. The synchronization of the EEG resultsand the generated eye tracking heat maps can provide clueson what exactly was influencing the brainwave variationsand patterns
https://sol.sbc.org.br/index.php/webmedia_estendido/article/view/21983/21806