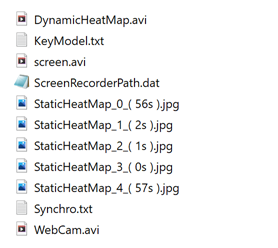
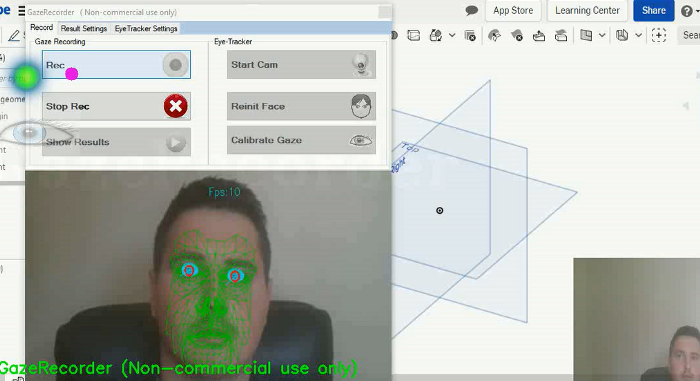
After recording has been stopped, data will automatically start to generate with the settings provided before. Results generation usually lasts as the recording itself. After results are generated, in the provided folder (Figure 4), users have available videos of the screen and webcam, as well as dynamically generated heatmap (see Figure 5) with the settings provided in the Results Settings tab (see Figure 3). Besides video recordings, static heatmaps are generated as .jpg file only if users defined static scenes described above. Finally, textual data is also available, which is used by GazeRecorder to generate a static and dynamic heatmap. To analyse the dynamic heatmap data, researchers can focus on qualitative analysis as an add-on data to triangulate the insights and gather more solid evidence which helps them in answering their research question. However, if researchers would like to focus solely on eye-tracking data, then they have to do further quantification of eye-gaze data. This quantification can be done with, e.g. protocol analysis, which enables researchers to get quantities of eye-gaze according to a predefined coding scheme. However, given the limited accuracy of the webcam eye-tracking, I would suggest using it in conjunction with other data.